US Air Quality Gradebook
Ambient
Gradesheets
![]()
|
Good air quality is necessary to avoid harmful health effects. According the Environmental Protection Agency, poor air quality causes visual impairment, reduced work capacity, reduced manual dexterity, poor learning ability, difficulty in performing complex tasks, neurological impairments, seizures, mental retardation, behavioral disorders, changes in airway responsiveness, respiratory illness, susceptibility to respiratory infection, lung inflammation, aggravation of respiratory conditions, chest pain, cough, decreased lung function, increased hospital admissions, |
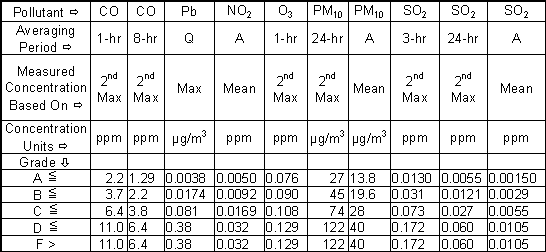
aggravation of cardiovascular disease, and premature death. The EPA has “primary standards” to protect the public against these health effects. These standards set concentration limits for six “criteria pollutants,” namely carbon monoxide (CO), lead (Pb), nitrogen dioxide (NO2), ozone (O3), particulate matter (PM), and sulphur dioxide (SO2). Hyperlinks below bring up gradesheets for US counties relative to these primary standards. The following are concentration limits associated with grades on the sheets: |

|
[1-hr, 8-hr, and 24-hr are averaging periods; Q = quarterly average concentration; A = annual; PM10 = particulate matter smaller than 10 micrometers; “2nd Max” allows “tossing out” one averaging period; ppm = parts per million; µg/m3 = micrograms per cubic meter.] |
|
The grade "A" represents the Best/Cleanest ambient concentrations in the US, and "F" the Worst/Dirtiest in the US. The grades reflect the statistical |
distribution of base-10 logarithms of the ambient concentrations for all measured US counties, as in the following table: |

|
The statistical procedure makes each grade limit a common
multiple of the next lower limit. For example, the upper grade A limit
for CO 8-hr before "rounding up" is 1.287 ppm, and the common multipler for the CO 8-hr distribution is |
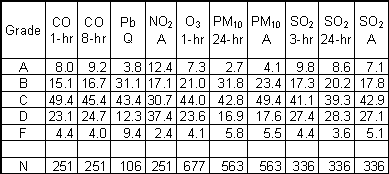
grade B is 1.287 x 1.701=2.189, When applied individually to the 10 ambient concentations, the procedure results in the following percentages of measured counties in the grade levels: |

|
[N = Number of measured US counties. Example: Grade D for CO 1-hr means at least 72.5% of the 251 measured US counties have smaller CO 1-hr ambient concentrations (72.5% = 8.0% A's + 15.1% B's + 49.4% C's).] |
|
A county's "ambient" grade is the grade of its worst individual pollutants, which are highlighted in bold italics. References for air quality include the Environmental
Protection Agency's National Air Quality and Emission Trends Reports at
online reference http://www.epa.gov/airtrends/.
An online reference for year 2001 ambient levels, as well as more recent ones,
is EPA's AIRData at https://www.epa.gov/outdoor-air-quality-data,
with data specifically at https://aqs.epa.gov/aqsweb/ |
NASA has a global satellite view of CO concentrations, which can be seen here. Click on a state to view a sheet showing grades for year 2001 ambient air measurements and the resultant county ambient grades. A blank in the gradesheet means there were no measurements of that pollutant. Missing counties had no ambient air measurements. One can use the gradesheets to determine what pollutants caused a county have the grade it does. A county's grade may be based on few measured pollutants. After viewing a gradesheet, click the browser's back button/arrow to return to this index page. |
Return to Air Quality Homepage