Global Temperature Increases |
Global Warming Will Put Miami Under Water |
|
SummaryGlobal Warming will increase temperatures from those of July 1, 2013, by about 6.9 degrees Fahrenheit, or 3.9 degrees Celsius, during Fossil Fuel Lifetime, until fossil fuel runs out in about 2240. The earth will experience a Climate Change and will revert to a mild climate similar to that of the Oligocene period of 23 to 34 million years ago. Polar ice will slowly melt to produce a Sea Level Rise of a few millimeters a year, which will reach 20.0 feet or 6.10 meters above the level of July 1, 2013, in about 2455. The current national and international policy of "reducing emissions" is futile because it only delays by a few years when the fuel is burned and only slightly alters the path to the eventual outcome. |
Rate of Climate Change"Global Temperature Increases" compared observed temperatures to long-term average temperatures at airports throughout the world, for the year prior to July 1, 2013. (See Airport Temperature and Deviation Charts, for the two weeks prior to July 1, 2013, and Regional Deviation Charts, for the year prior to July 1, 2013.)The "Global" Regional Deviation Chart shows global deviation from long-term average temperature. The average of the deviation over the whole year of the Global chart from July 1, 2012 to July 1, 2013 was |
|
The Airport Temperature and Deviation Charts are based on historical
recorded temperatures that generally span from 1942 to 2009,
with an average midpoint of 1975. (See
Historical Recorded Temperatures.)
Taking 1975 as the reference date of the typical period of record, the global deviation is
a direct measure of global warming from 1975 to July 1, 2013, a period of about 38 years. That
translates to the following depictions of the rate of climate change: 0.029 degrees Fahrenheit per year = 0.016 degrees Celsius per year 0.29 degrees Fahrenheit per decade = 0.16 degrees Celsius per decade 2.2 degrees Fahrenheit = 1.2 degrees Celsius over a lifetime of 77 years 2.9 degrees Fahrenheit per century = 1.6 degrees Celsius per century How Long Will Fossil Fuel Last?The remaining fossil-fuel lifetime is calculated as follows:We have the following remaining world fossil fuel as of, say, 2007: [From the U.S. Energy Information Administration data for conventional fuels World Recoverable Coal 2005, and table 11.4, page 307, Annual Energy Review 2007, the World Energy Council for oil shale, table 3-1, pages 101-102, 2007 Survey of Energy Resources, and the U.S. Geological Survey for oil sands and heavy oils -- Table 8, page 23 of Heavy Oil and Natural Bitumen Resources.]
[In the table above, the 48 percent recovery factor is from an estimate by the RAND corporation for the recoverable resources of the U.S. oil shale: Oil Shale Development in the United States.] On page ix, the study found a recoverable 800 billion barrels from 1.5 to 1.8 trillion barrels in the Green River Formation of Colorado, Utah, and Wyoming. This yields the following recoverability estimate: 48 percent = 800 billion barrels / 1,650 billion barrels The same recovery factor was applied as well to oil sands and shale oil. Energy experts seem to agree that early estimates of recovery for these two sources were too low, and the Energy Information Administation recently used a range of 30 to 60 percent for them. See the last several slides, starting with The World's Primary Additional "Oil" Resources, in When Will World Oil Production Peak?. In discussions about the presentation, an Energy Information Administration contact noted that they used 30 to 60 percent because "We felt like the others were too conservative." The 48 percent is in the middle of that range.] The links Energy Calculator - Common Units and Conversions, and SI prefixes give the following energy equivalents:
J = Joule
These conversions yield the following energy equivalents of remaining fossil fuels:
The rate of fossil-fuel consumption (or production) for 2005 was as follows: [From the U.S. Energy Information Administration for conventional fuels, table 11.1, page 301, World Energy Production 1970 - 2005, for oil shale from page 84 of Global Oil Shale Issues and Perspective, and for oil sand and heavy oil from Heavy Oil and Natural Bitumen--Strategic Petroleum Resources.]
The time to depletion at 2005 rates of consumption would therefore be
66,183 Quads / (399.72 Quads per year) = 166 years However, this calculation makes the unrealistic assumption that consumption remains constant at the 2005 rate until the moment of totally exhausted fossil-fuel resources. To assess what pattern future consumption might actually follow, consider crude oil production for 1859-2050, which is the same as crude oil consumption: The Oil Age Poster. Crude oil consumption peaks about 2010, close to the present time. We might expect total fossil fuel consumption to follow a similar pattern, with its peak delayed until perhaps about 2035, and tailing off until it is gone by about 2240, as in the following: |
 Fossil Fuel Consumption
1015 Btu / Year
ZJ / Year
Year
Total
Crude Oil
Coal
Natural Gas
66,183 * 1015 Btu
69.83 ZJ
|
Ultimate Temperature IncreaseConsumption under the "Fossil Fuel Total" curve from 2008 until complete depletion is necessarily equal to the total available, namely 66,183 Quads = 69.83 ZJ. Altering the consumption pattern may compress or expand temperature increases for periods of time, but should ultimately reach about the same temperature. For example, consider the following three fossil-fuel consumption scenarios. All three will use the remaining fossil fuel supply, which is was slightly smaller than 66,183 Quads as of July 1, 2013, because of intervening consumption -- about 64,083 Quads.1. Expected: The "Total Fossil Fuel Consumption" curve just described. 2. 2005 Cap: Suppose the world reduces emissions this year to the 2005 rate of 399.72 Quads per year until 2105, and then consumption tails off as in case 1 to zero in 2240, so that the total use during the remaining fossil fuel lifespan from 2013 until 2240 remains 64,083 Quads. 3. 1975-2013 Average: Suppose the 1975-2013 average rate of 320.81 Quads per year had been the case from the reference year 1975 until fossil fuel is exhausted at that rate of consumption in 2213 -- still consuming the available 64,083 Quads from 2013 until 2240. The three cases are shown in this graph: |
 Fossil Fuel Consumption Scenarios
1015 Btu / Year
Year
1975-2013 Average
2005 Cap
Expected
|
|
Here are the corresponding temperature increases: |
 Temperature Increases for
Fossil Fuel Consumption Scenarios ° Fahrenheit
Year
1975-2013 Average
2005 Cap
Expected
|
|
How on earth does it make any difference? The ultimate increase is about 6.9 degrees Fahrenheit = 3.9 degrees Celsius, no matter what the slight alterations of the consumption curve. You might as an exercise try modifying the curve yourself to one you "like" better. The constraint is that the total integrated area from 2013 until depletion must equal the total remaining fossil-fuel supply, namely 64,083 Quads. (It is a very slightly smaller area than the 66,183 Quads colored yellow graph, because the area above the years 2008 through 2012 is missing at its left edge.) You quickly see that it just isn't possible to change it in any way that will realistically happen and make any difference at all. The temperature increase will be about the same whether the time until depletion is compressed a few years by increased consumption, or delayed a few years by reduced consumption resulting from efforts to reduce CO2 emissions, or by scarcity and high fuel prices. There is simply no realistic way that the world will be able to alter the total fossil-fuel consumption curve that will make any appreciable difference in the eventual total amount of CO2 going into the atmosphere, or in the time frame in which that will occur. Calls for reduced emissions really mean that instead of burning the fossil fuels today, they will be burned a few years hence. The overall effect will be the same total amount of carbon dioxide going to the atmosphere in approximately the same amount of time, in a system with a response time of a millennium (See Study Says Some Global Warming Now Irreversible). The world would have to agree not just to defer burning fossil fuels by a few years -- it would have to agree not to burn them at all, ever, and to use the hydrocarbon resource instead for what it ought to be used for, namely as a raw material for plastics and other products of organic chemistry. We all know that there is no chance the world will ever agree to that. Global warming alarmists are fond of presenting temperature increase on plots such as the first figure below in the section, "Global CO2 Concentration." That plot's range is only about -8 to +2 degrees Celsius, or about -14 to +4 degrees Fahrenheit. However, the entire plot is only a tiny portion in the earth's temperature history. The real relevant plot is this one: Climate History. The present average global temperature is about 14.6 degrees Celsius, or 58.3 degrees Fahrenheit. The ultimate temperature increase before fossil fuel runs out will take earth's temperature to about 14.6 + 3.9 = 18.5 degrees Celsius, or about 65.3 degrees Fahrenheit, which is 19% of the way between the 17 and 25-degree gridlines of the plot. That will take earth to a climate like that of the "Oligocene" period of 23 to 34 million years ago -- long before humans existed: Oligocene Climate. The reference Geologic time scale characterizes the "Oligocene" period this way: "Warm but cooling climate, moving towards Icehouse; Rapid evolution and diversification of fauna, especially mammals. Major evolution and dispersal of modern types of flowering plants." |
Global CO2 ConcentrationGlobal-warming alarmists like to present a graph of global CO2 concentration like this one, from Al Gore's documentary An Inconvenient Truth -- complete with dramatic on-stage hydraulic lift.
The title at the upper left reads: "650,000 Years of CO2 and Temperature". The scale at the left says, reading from bottom to top: "CO2 [ppm] 200 250 300 350 400". The years before present along the bottom read "600,000 500,000 400,000 300,000 200,000 100,000 0." The CO2 concentrations are the red curve, and temperatures the light blue. Conveniently (for his inconvenient truth), Gore omitted the temperature scale other than saying it is "Temp. in F°" over on the right. Most people viewing the documentary probably assumed that the scale went from 0 to 100 degrees Fahrenheit, or something similar. In fact, the temperature range over the whole 650,000 years is only about -14 to +4 degrees Fahrenheit. The yellow text where Al is pointing reads: "Today's CO2 concentration." The implication left by Al Gore's message and other alarmists who talk about "tipping points" is that the earth is entering a realm of CO2 concentrations never before experienced, and that "dire consequences" are about to ensue. That is, however, not the real graph of planet earth CO2 concentrations. Here is the real graph: 
7500
6000
4500
3000
1500
0
ppm

[History of Atmospheric CO2 through geological time (past 550 million years: from Berner, Science, 1997). The parameter RCO2 is defined as the ratio of the mass of CO2 in the atmosphere at some time in the past to that at present (with a pre-industrial value of 300 parts per million). The heavier line joining small squares represents the best estimate of past atmospheric CO2 levels based on geochemical modeling and updated to have the effect of land plants on weathering introduced 380 to 350 million years ago. The shaded area encloses the approximate range of error of the modeling based on sensitivity analysis. Vertical bars represent independent estimates of CO2 level based on the study of ancient soils.] Thus, multiply the "R" scale at the left by 300 to convert to ppm. It is very clear from this graph that the present fluctuations in CO2 concentrations hardly count as a blip in real earth CO2 history. The entire preceding graph and all of the preoccupations of alarmists are under the small yellow dot at the graph's right edge, like this: 
To see more about real CO2 earth CO2 concentrations throughout geologic time, see the notes at the ends of "major events" in the following geologic time scale: Geologic time scale |
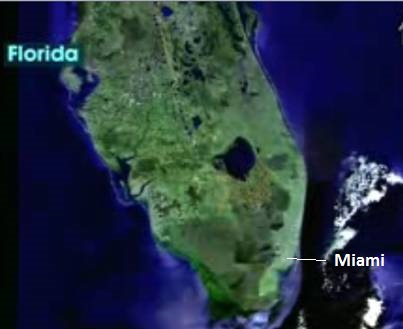
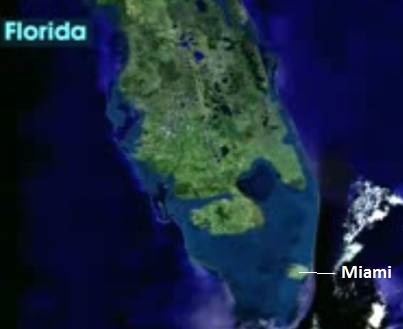
Sea Level RiseIn his documentary, Al Gore introduced the following illustrations this way: "If this [West Antarctica] were to go, sea level worldwide would go up 20 feet. Greenland would also raise sea level almost 20 feet if it went. If Greenland broke up and melted, or if half of Greenland and half of West Antarctica broke up and melted, this is what would happen to the sea level in Florida:" |
|
|
He left the impression on the audience that the inundation was going to happen
rapidly with great associated turmoil: "Think of the impact of a
couple hundred thousand refugees when they are displaced by an environmental event,
and then imagine the impact of a hundred million or more." Nothing is going to happen suddenly. As with temperature increases, sea level rise is a very slow process. The rate of rise for 1961-2003 was about 1.8 millimeters per year, and the rate for 1993-2003 had increased to about 3.1 millimeters per year. See Table 5.3, page 419, in Observations: Oceanic Climate Change and Sea Level. For the complete IPCC report, see Climate Change 2007: The Physical Science Basis. How will these rates respond to future temperature increases as described above? The thermodynamics of ice is pretty basic: if the temperature is below zero degrees Celsius, nothing happens (except the ice gets a little colder). On the other hand, if the temperature is above zero Celsius, it melts -- and the higher the temperature above zero, the faster the melt occurs. Much of Antarctica never has temperatures above zero, but the margins of the continent and Greenland can experience times when the temperature is above. The nature of ice melt -- nothing below zero and melt above zero -- is an example of many processes in the physical and biological world that are triggered only if the temperature is above some critical temperature -- which for ice melt is zero Celsius. Daily Temperature Cycle is actually well suited to studying such processes. For ice melt, consider the temperature record at Qaanaaq, Greenland (Thule Air Base), station BGTL. Consider this an index temperature station for those ice-sheet areas of the world where the temperature hovers close to zero, and which will be affected by the temperature increases of global warming. Using the observed temperature record for the station, we can impose the global warming temperature increases (the "Expected" above), and simply sum up all hourly temperatures that are above zero. For example, if temperatures in Celsius for seven consecutive hours are 3, 1, 0, -2, -1, 1, and 4, the sum is 3+1+1+4 = 9. Performing the sum over all hours each year gives the "Positive Degree Hours per Year" of the following graph: |
 Positive Degree Hours per Year
Qaanaaq, Greenland ° C - Hours / year
Year
|
|
The rate of ice melt, and therefore of sea-level rise, relates directly to these positive degree hours. The correspondence is specified by the rates just mentioned of 1.8 millimeters per year for 1961-2003 and 3.1 millimeters per year for 1993-2003, and an assessment that a zero rate of sea-level rise corresponded to a temperature of 0.5 degrees Celsius below the 1951-1980 average (See A Semi-Empirical Approach to Projecting Future Sea-Level Rise.) After increasing during the remaining fossil fuel lifespan until 2240, when fossil fuel will be exhausted, temperatures and therefore the positive degree hours and resultant melting will remain "almost constant for more than 1,000 years." (See Study Says Some Global Warming Now Irreversible.) Here is the resultant similarly-shaped graph of rate of sea-level rise: |
 Rate of Sea Level Rise
Millimeters per Year
Year
|
|
(Even when the rate was zero to the left of the graph, many positive degree hours were needed to balance the snowfall accumulation on the ice sheets each winter.) Accumulating each year's rate gives the following graph of sea-level rise from now: |
 Sea Level Rise
Meters
Feet
Year
|
|
Sea-level rise at the time fossil fuel runs out in 2240 under "Expected" fossil-fuel consumption is 2.65 meters, or 8.7 feet. Because temperatures will remain elevated even after that happens (but not continue to increase), the melting will continue, and the sea-level rise will reach 6.10 meters, or 20.0 feet, by 2455. So -- yes -- the inundation of most of Miami and other low-lying areas will occur. However, it will take more than four centuries for it to happen. That is not an "environmental event" on a human-lifetime scale, but rather on a geologic time scale. It will be beach erosion of a few millimeters a year. It will take place very slowly, and people will have plenty of time to adjust. It will not even remotely look like the "environmental catastrophe" presented by global warming alarmists. People will do what land animals have always done as the land areas of our planet shifted: live where the water isn't. For a map of areas that will be slowly inundated over the next few centuries by a 6-meter rise in sea level, see Global Map of 6 Meter Sea Level Rise. The average elevation of Miami is actually only 6 feet. Thus, in 2188 when sea level has risen by six feet, half of Miami will be under water. In 2455, with a 20-foot sea level rise, most of present-day Miami will be under water. However, the maximum elevation is 26 feet, so there will be a small portion still above water — as shown in the representation of the sea level rise in southern Florida above, where Miami has been reduced to a tiny island barely above water off the new coast of Florida to the north. However, sea level will be continuing its rise at the time, as shown in the graph above, and will reach 26 feet and completely cover even the remaining tiny island in about 2569. Miami is only one example, of course. Globally, in 2455 with a 20-foot (6 meter) sea level rise, a present-day land area of about 850,000 square miles will be under water, where about 430 million people live today. This land area is about 14 percent greater than the land area of Mexico, and this population is about 36 percent greater than the present population of the United States. Risk of Rising Sea Level to Population and Land Area. If as above we consider a return to temperatures similar to the Oligocene period of 23 to 34 million years ago, during the Oligocene ice covered the South Pole but not the North Pole. During the Late Eocene (34 to 37 million years ago), ice had just started to form at the South Pole. Because land masses are configured differently now, and these greatly influence temperatures at the poles, the amount of polar ice will not be exactly the same as it was then. The Antarctic ice sheet started forming about 34 million years ago after an isthmus connecting the southern tip of South America to Antarctica severed and the Southern Ocean surrounding Antarctica swept completely around the continent and became isolated from warmer waters to the north. Ice in Greenland began forming 5 million years ago after the Isthmus of Panama blocked ocean currents that had formerly flowed between North and South America from the Pacific to Atlantic. How the Isthmus of Panama Put Ice in the Arctic. |
MethaneAnother global warming alarmist favorite is methane. For example, John Atcheson, in the Baltimore Sun December 16, 2004, wrote: "There are enormous quantities of naturally occurring greenhouse gasses trapped in ice-like structures in the cold northern muds and at the bottom of the seas. These ices, called clathrates, contain 3,000 times as much methane as is in the atmosphere. Methane is more than 20 times as strong a greenhouse gas as carbon dioxide... There's 400 gigatons of methane locked in the frozen arctic tundra...."Methane Burps: Ticking Time Bomb. So, who is saying all of that is going to be released -- or even a sizable portion of it? Nobody. After 2000-era plateau, global methane levels hitting new highs. Atcheson continued: "....about 55 million years ago in what geologists call the Paleocene-Eocene Thermal Maximum (PETM), when methane burps caused rapid warming..." Nope. Not now. Not then. It came from tropical wetlands: Study Rules Out Ancient 'Bursts' of Methane from Seafloor Deposits, Methane Burps Disproved. Clathrates require both cold temperatures and high pressure to form. They are associated with deep permafrost and subsea layers where sufficient pressure can develop. Articles about melting of near-surface permafrost do not relate to the deep-lying clathrates. Indeed, clathrates seem very difficult to get at. Even though energy companies would like very much to be able to tap the energy store, nobody has been able to find a viable way to recover their energy. What do we expect during the remaining lifetime of fossil fuels? Methane sources and sinks are in near balance. The largest natural source is wetlands, with several major anthropogenic sources. The largest sink is oxidation by OH in the troposphere: Methane Sinks - The Atmosphere. See Table 7.6 page 542 of Couplings Between Changes in the Climate System and Biogeochemistry. In the remaining 170 years or so of fossil-fuel lifetime, we can expect more of the same -- near balance between methane sources and sinks. Alarmists talk about methane as if no one has considered it. In fact, it is included and considered carefully and completely in all analyses. |
Burning Our Raw MaterialOur modern society is constructed of plastic, which is ubiquitous and exceedingly inexpensive. It would be hard to imagine it being otherwise. What is the raw material of plastic? Fossil fuel. Hydrocarbon.It is the natural resource that mankind is doing its best to burn up completely. The principal raw material for plastic will have just gone up in smoke. The same applies to other products so critical to our modern world, like fertilizers and petrochemicals. Fossil fuel is too precious to burn -- but, of course, that is what the world is going to do. Then, without having set up any replacement renewable energy, and without the raw material for plastic from which most of the "stuff" of the modern world is constructed, it will try to create a whole new world without fossil fuels. We should not even be thinking of it as fossil fuel. We should instead regard it as our organic "ore" -- the raw material of organic chemistry, which produces all those marvelous things that allow our modern society to function. Plastic products are, moreover, recyclable many times over: today's Coke bottle is tomorrow's shirt. The lifetime of organic "ore" used this way would be very long, indeed, and would be available for many generations to come. It reminds you of another society that used its natural resources for stupid things, and then paid the consequences. Most people think, "How could they do that?" when they hear the story of how Easter Islanders chopped down every tree on their island and then had no raw materials for boats to harvest fish for food or, for that matter, to escape. Yet, we are doing exactly the same thing by burning a basic raw material of our world. See Fossil Fuel Limits & Hidden Dependencies: Plastics, Fertilizers, Petrochemicals, A Partial List of Products Made from Petroleum, Oil: Too Valuable to Burn, The Fate of Easter Island. ... or, as "V'ger" of Star Trek: The Motion Picture might ask though its "voice" the Ilia probe, "Why are the carbon-based units burning their carbon base?" See Abriged Script of Star Trek: The Motion Picture, Lieutenant Ilia, The Ilia probe. |
ConclusionIn giving the reasons why the United States was rejecting the Kyoto protocol, President George W. Bush stated on February 14, 2002:"The approach taken under the Kyoto protocol would have required the United States to make deep and immediate cuts in our economy to meet an arbitrary target. It would have cost our economy up to $400 billion and we would have lost 4.9 million jobs. As President of the United States, charged with safeguarding the welfare of the American people and American workers, I will not commit our nation to an unsound international treaty that will throw millions of our citizens out of work." President Announces Clear Skies & Global Climate Change Initiatives. He might have added "futile" to his characterization. Committments of the protocol for reducing emissions simply delay them by a few years and only slightly alter the path to the eventual outcome. What would be required instead would be an international policy that allocates remaining fossil "fuel" as an organic raw material for plastics and other organic materials, and rejects forever its burning as fuel. Such a policy would necessarily immediately set the world on an intensive global effort to develop sustainable energy sources to replace the fossil fuel not being consumed. Nobody expects that such an accord could be reached. It probably never will, and the world will undoubtedly burn most of the remaining fossil fuel. The remaining Fossil Fuel Lifetime will be until about 2240. Global Warming during this time will increase temperatures from those of July 1, 2013, by about 6.9 degrees Fahrenheit, or 3.9 degrees Celsius. The earth will experience a Climate Change and will revert to a mild climate similar to that of the Oligocene period of 23 to 34 million years ago. Sea Level Rise will continue slowly at the rate of a few millimeters a year, and will reach 20.0 feet or 6.10 meters above the level of July 1, 2013 in about 2455. This will happen very slowly and there will be none of the sudden, catastrophic global floods depicted by alarmists. It will be beach erosion of a few millimeters a year and people will have plenty of time, over centuries, to adjust. |
|
|
