Delaware Air Quality
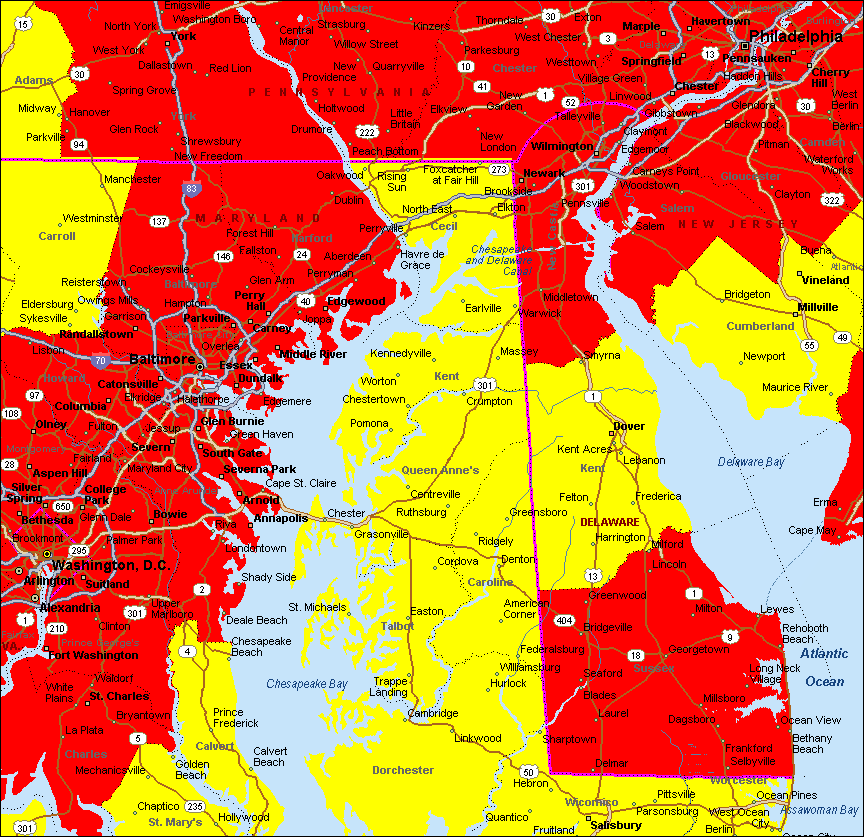
Delaware Air Quality Map

Grade A Color: Blue

 A    

Grade B Color: Cyan

 B    

Grade C Color: Green

 C    

Grade D Color: Yellow

 D    

Grade F Color: Red

 F

A = Best/Cleanest in the US; F = Worst/Dirtiest in the US.

Return to Maps Homepage

Abstract: US Air Quality Gradebook ("AirGrades") maps present a visual picture of air quality for more than 3,000 US counties.  This map shows Delaware air quality by county.

Grades are based on air pollution data from the Environmental Protection Agency (EPA) for 10 measures of ambient pollutant concentrations and for emission tonnages of 11 air pollutants.