Global Temperature Increases |
Global Deviations Map |
|
|
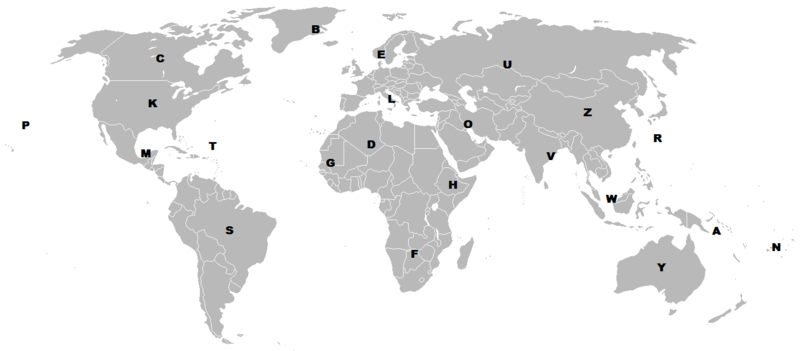
The map shows shows 2-week and 3-month deviations in Fahrenheit averaged over all stations in a given region.
These deviations relate directly to the question of how current temperatures compare in general
with the historical record when day-to-day "noise" has been reduced by the averaging. |
|
The region's 2-week deviation is indicated in magenta, as the lower number. The average of the 2-week deviations for the past 3 months is shown in green, as the upper number. |
|
|
|
| The regions correspond to the first letter of the airport code, as follows: |
|
A - Western South Pacific B - Iceland and Greenland C - Canada D - West Africa E - Northern Europe F - Southern Africa G - Northwestern Africa H - Northeastern Africa K - United States of America L - Southern Europe M - Central America |
N - South Pacific O - Middle East P - Pacific R - Western North Pacific S - South America T - Caribbean U - Former Soviet States V - Mainland Southeast Asia and South Asia W - Maritime Southeast Asia Y - Australia Z - China |
|
|
 Much Above Normal (2 or more degrees
above normal)
 Above Normal (1-2 degrees
above normal)
 Near Normal (within 1 degree
Fahrenheit)
 Below Normal (1-2 degrees below normal)
 Much Below Normal (2 or more degrees
below normal)
